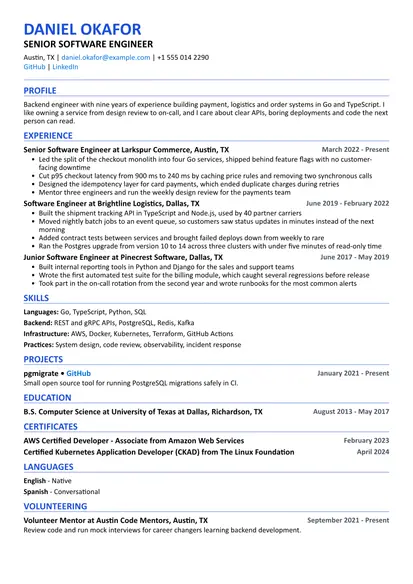
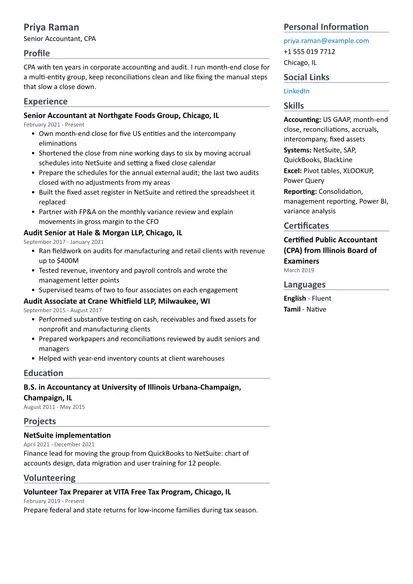
This template is built for data analysts, reporting analysts and business intelligence analysts. It uses the Two Column layout: experience and projects run down the main column, while tools, certifications and languages sit in a narrow side column where a recruiter can check them in a few seconds. The sample belongs to a senior analyst with six years in retail and subscription companies. Swap in your own work and delete the sections you don't need.
Template at a glance
| Setting | This template |
|---|---|
| Layout | Two Column, with tools and certifications in the side column |
| Length | One page, two for leads with long careers |
| Best for | Data analysts, BI analysts, reporting analysts, product and marketing analysts |
| Section order | Summary, experience, projects, education, then skills, certifications and languages on the side |
| Also works in | ATS Friendly (for employers with strict tracking systems), Compact (when you have many projects) |
What hiring managers look for
People who hire analysts usually want to know two things. Can you get correct numbers out of messy data without someone checking every query? And can you explain those numbers to someone who does not care about joins or window functions? Your resume should answer both.
The first question is about technical skill. Show it through the tools you name and through bullets that mention real data work: building a model, fixing a pipeline, cleaning a table that everyone was afraid of. The second question is about judgment and communication. Show it by naming the people who used your work and what they decided because of it.
Analytics managers also look for ownership. An analyst who "ran reports" sounds replaceable. An analyst who "owns the weekly revenue dashboard and answers questions about it from finance" sounds like someone the team depends on. If a report, a dashboard or a metric belongs to you, write that plainly.
Many resumes reach a recruiter before a hiring manager, and recruiters search for tool names. Spell them the way job posts do: SQL, Tableau, Power BI, Looker, Python, R, Excel, Snowflake, BigQuery. A manager reading later will look past the tool list to the questions you answered.
How to write each section
Header and contact details
Your name, the title you are aiming for, city and state or country, email, phone and one or two links. LinkedIn is expected by most recruiters. A GitHub, Tableau Public or personal site link is worth adding if it shows finished work. A full street address is not needed.
Titles in analytics vary a lot. "Insights Associate", "Reporting Specialist" and "Business Analyst II" can all describe the same job. If your official title is unusual, use the clearest honest version in the header, such as "Data Analyst", and keep the real title on the job entry if you prefer.
Summary
Two or three sentences: your level, the kind of business you know, your main tools and the sort of questions you like answering. Avoid "detail-oriented" and "data-driven", which every analyst resume already says. Here is the pattern at three levels:
Entry level: Recent economics graduate with a year of part-time reporting work and two portfolio projects in SQL and Tableau. Comfortable cleaning messy spreadsheets and writing up findings for people outside the data team.
Mid-level: Data analyst with three years in e-commerce, working mostly in SQL, Looker and Python. I build the dashboards marketing uses to plan campaigns and enjoy digging into why a number moved.
Senior: Senior data analyst with six years in retail and subscription businesses. I own core sales reporting, run A/B tests with product teams and help managers turn loose questions into metrics they can track.
Experience
List jobs newest first, with company, title, city and dates by month and year. Give recent roles three to five bullets and older roles one to three. If the company is not well known, add a short line about what it does, for example "Regional grocery chain, 85 stores".
Analysts often support several teams. If you do, it helps to say which ones: "Supported marketing, merchandising and finance." It tells the reader what kind of questions you are used to.
Projects and portfolio
Projects matter more for analysts than for many other jobs, because so much of your daily work is confidential. A good project shows the whole cycle: a question, a data source, the cleaning, the analysis and a clear answer. Give each project one or two lines with the question, the tools and where the work can be seen.
Public data works well: city open data portals, government statistics, sports results or anything you collect yourself. Pick a topic you actually find interesting, because interviewers will ask about it and it shows when you care. Leave out course exercises that thousands of people have also published unless you added something of your own.
Skills
Group your tools so a reader can scan them: data and databases, analysis languages, BI and reporting, and a short line for how you work. Put the strongest tool first in each group. The side column in this layout keeps the list short, which is a good thing.
Education
Degree, school and years. Statistics, economics, mathematics, computer science and business are common, but many good analysts come from psychology, biology, journalism or engineering. Relevant coursework is worth a line only while you are early in your career. Bootcamps and online programs go here too.
Certifications
Tableau, Microsoft Power BI and Google Cloud certifications are the ones job posts mention most. List the exact name, the issuer and the year. A general certificate from an online course is fine for career changers, but drop it once your experience speaks for you.
Writing experience bullets
Good analyst bullets name the question, the method and the outcome. The outcome is not always money. It can be a decision someone made, a process that got faster, a report that people stopped asking you to rebuild, or an error that got caught before it reached a board slide.
A pattern that works: what you analyzed or built + how + who used it or what changed.
- Weak: "Created dashboards for the sales team."
- Better: "Built the regional sales dashboard in Power BI, now used weekly by 12 sales managers to set targets."
Use numbers you can defend in an interview: rows, users, hours saved, number of reports, test results. If you only know a result roughly, say "about" or describe it in words. Analysts get asked where their numbers came from more than most people.
Examples by level
Entry-level or junior analyst
- Wrote SQL queries to pull weekly order data for the operations team and checked totals against finance
- Cleaned a customer list of 80,000 rows in Excel and Python, removing duplicates before a mailing
- Rebuilt three Excel reports in Power BI so managers could filter by region themselves
- Documented the logic behind each report column so new team members could answer basic questions
Mid-level analyst
- Built a funnel analysis of the sign-up flow that showed most drop-off happened at email verification
- Automated the monthly KPI pack with SQL and scheduled refreshes, saving the team two days each month
- Worked with marketing to define "active customer" and rolled the definition out across five dashboards
- Ran a pricing test readout and presented results and caveats to the product director
Senior or lead analyst
- Own core revenue metrics and the dashboards finance and leadership use in the weekly business review
- Set up the A/B testing process with product, including sample size checks and a shared readout template
- Mentor two junior analysts and review their SQL before work goes to stakeholders
- Led the move from spreadsheet reporting to a dbt and Snowflake setup with tested, documented models
Examples by specialty
Product analytics
- Defined engagement metrics for the mobile app and built the event tracking plan with engineers
- Analyzed feature adoption after launch and found that most users never reached the new screen
- Built retention cohorts that the product team now reviews in every monthly planning meeting
Marketing analytics
- Built a channel report combining ad spend and orders, which showed one paid channel was mostly reaching existing customers
- Measured the effect of email campaigns with holdout groups instead of last-click numbers
- Created a customer segmentation in Python used to plan three seasonal campaigns
Finance and operations
- Built a weekly cash and orders forecast in Python, compared each week against actuals
- Created a labor scheduling report that helped store managers match staff to busy hours
- Reconciled warehouse and finance inventory numbers and traced the gap to a timing issue in one feed
Healthcare and public sector
- Produced monthly patient volume reports for 12 clinics, used to plan staffing
- Linked appointment and billing data to find clinics with high no-show rates
- Prepared data for state reporting with checks that caught missing fields before submission
Business intelligence
- Maintained 30 Tableau dashboards and retired the 10 that nobody had opened in six months
- Built a shared data source with certified metrics so teams stopped arguing over different totals
- Cut a slow dashboard's load time by moving heavy calculations into the warehouse
Skills and keywords
Recruiters and tracking systems search for exact terms. Use the names that appear in job posts and only list what you have used for real work or a finished project.
| Category | Common examples |
|---|---|
| Query and databases | SQL, PostgreSQL, MySQL, SQL Server, Snowflake, BigQuery, Redshift |
| Analysis | Python, pandas, R, statistics, regression, A/B testing, forecasting |
| BI and visualization | Tableau, Power BI, Looker, Looker Studio, Qlik, Excel charts |
| Spreadsheets | Excel, pivot tables, XLOOKUP, Power Query, Google Sheets |
| Data preparation | dbt, ETL, data cleaning, data modeling, Airflow |
| Methods | Cohort analysis, funnel analysis, segmentation, KPI design |
| Working with people | Requirements gathering, stakeholder communication, presenting findings |
Soft skills carry a lot of weight in this job, but listing "communication" proves nothing. Show it in bullets instead: presenting a readout to a director, agreeing on a metric definition with two teams, or writing documentation that people use.
Tailoring your resume to a job post
Analyst jobs vary more than the title suggests. A "data analyst" at a bank may spend the week in Excel and SQL Server, while one at a startup works in Python and dbt. Ten minutes of editing per application helps:
- Read the post and mark the tools, the business area and the type of work it repeats, such as dashboards, ad hoc analysis or experiments.
- Make sure the tools you really have appear in your skills and in at least one bullet.
- Move the bullets that match the job's main work to the top of each role.
- Change the first sentence of your summary to match the role, for example "marketing analyst" for a marketing job.
- Swap in the project closest to the job's domain, if you have one.
Use the post's words when they are true for you. If it says "stakeholder management" and you run weekly reviews with three teams, use that phrase in a bullet.
Formatting and length
One page for most analysts. Use one font at 10 to 12 points, consistent dates and the same number format throughout, for example "1.2M" everywhere rather than mixing it with "1,200,000". You would notice inconsistent numbers in a report, and so will the reader.
Don't put charts, skill bars or rating dots on the resume. They are hard for tracking systems to read and say little about real skill. A link to a dashboard you built does the job better. Save the file as a PDF and name it clearly, for example "Maya-Castellano-Data-Analyst.pdf".
Why the sections are in this order
Experience comes first because real business questions you have answered matter more than anything else. Projects follow straight after, since they let a reader see your work when your job's dashboards are private. Education comes next and stays short.
Skills, certifications and languages sit in the side column, so the tool list is visible next to every job without taking space from your bullets. If you work in a larger company with a strict tracking system, the ATS Friendly layout used in the software engineer template puts everything in one column. If you are a student or career changer, put projects above experience and look at the student template for how to present coursework. Analysts with a finance background may also find useful phrasing in the accountant template.
Mistakes to avoid
- Listing tools without saying what you did with them
- Bullets that describe a dashboard but never say who used it
- Sharing confidential numbers, client names or screenshots from work
- Skill bars and star ratings for SQL or Python
- Portfolio links that lead to empty repositories or broken dashboards
- Inconsistent number and date formats on a resume that claims attention to detail
- Calling yourself an expert in machine learning after one course
- Leaving out the database or warehouse you used, which recruiters often search for
Checklist before you send it
- Your title and first summary line match the role
- SQL and the main BI tool from the job post appear where they are true
- Every recent job has at least one bullet with a user, a decision or a result
- Project links open, load quickly and show finished work
- Numbers, dates and tool names are written the same way everywhere
- The file is a PDF with your name in the file name